Category Archives: Graphic Design

A Better Bike Map: Reimagining Your Design

Creating a map geared towards bike transportation is a challenging task, but a relevant one. With an urbanizing, mobile population and a growing need to find fast, efficient, and cheap alternatives to automobile transportation, effective communication of bicycle routes and associated bicycle-friendly infrastructure is becoming more important. The major problem is that most bike maps, due to the nature of their content, easily get crowded, cluttered, and hard to read. This requires a paradigm shift, and finding where the happy medium of effective content and supplemental information exists. This post is the first in a series that will discuss what cartographic characteristics make an effective bike map. We will ask and attempt to answer a number of questions, and then provide a high level survey on the state of bike maps while suggesting some optimal solutions.

On the vast spectrum of viable transportation choices, a bicycle is one of the few options that is not a motorized vehicle but still allows for a large amount of personal mobility and freedom. Less intrusive than a scooter or moped, more practical than a skateboard or rollerblades, a bike fits somewhere in the vicinity of half car/half pedestrian. A bicyclist can go just about anywhere with only a handful of limited restrictions, but can also effectively flow with automobile traffic down major roads, and when doing so must follow the rules of the road (Ever gotten pulled over for running a red light on a bike?). But a bike is not a car, and the flexible nature of biking and lack of exclusive bicycle infrastructure in most urban areas make creating an effective bike map a challenging task that remains open to much interpretation and subjectivity. You can see this in the handful of bike maps in the illustration below, where as opposed to a traditional road map, it becomes very hard to intuitively distinguish what each feature is.

citysamples-01So this begs a number of questions. Does a holy grail for how to create the “perfect” bike map exist? What kinds of wayfinding tools can address this and direct bikers towards efficient and safe navigable routes? With the large amount of interpretation, subjectivity, and non-exclusive use bicycle infrastructure, what criteria can be defined that will refine content and make the ideal bike map?

From a design perspective the best way to address these questions is to simplify them, and of course ask a few more. What is important to a cyclist? What do they need to navigate? What features on a map are necessary to facilitate the most efficient bike transport? Where are they trying to go? Are riders commuters or recreational? The following are three important considerations in bike map design that help answer these questions, each important in its own right. They include knowing your community and its infrastructure, rethinking your design hierarchy, and awareness of technologies that might provide the most effective ways to convey your map and its content to the user.

1. Know your community and it’s infrastructure

2013-05-05 13.52.16

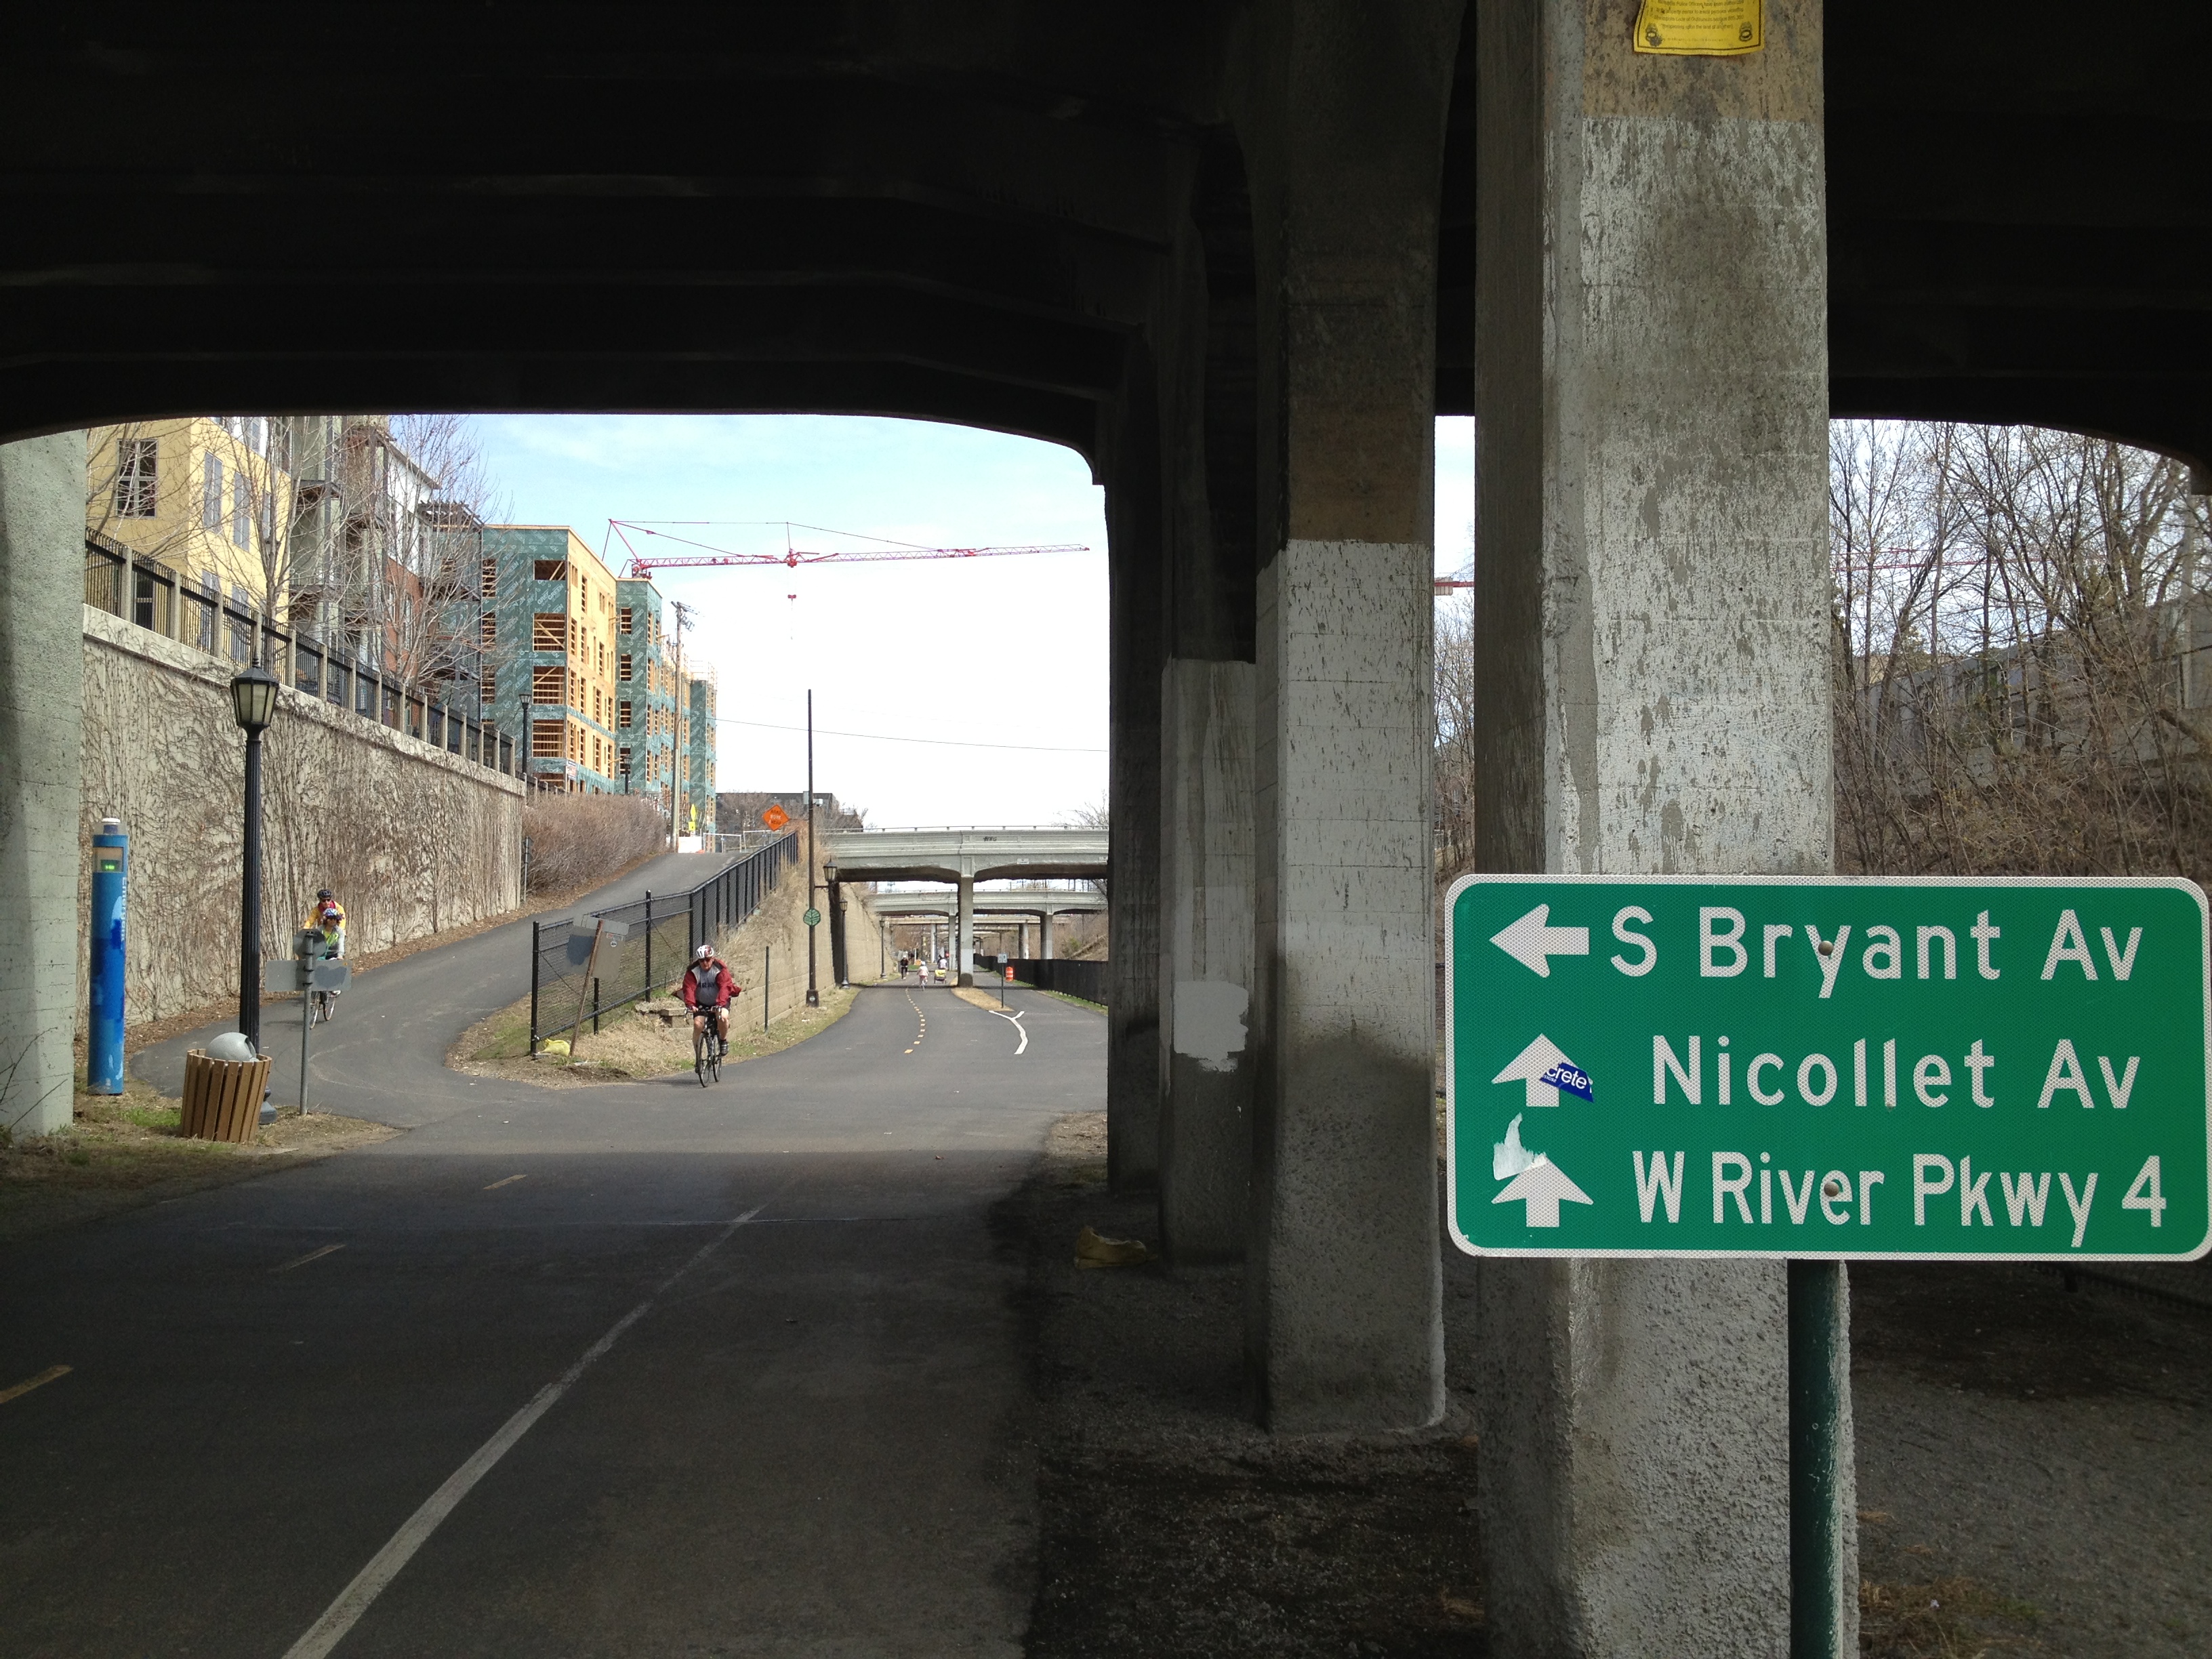
Midtown Greenway “Bike Highway” – Minneapolis

Perhaps the most important component of effective bike map design is knowing your local community. Specifically, knowledge on the extent, location, and quality of the physical bicycle infrastructure in the region, along with familiarity on the users of that infrastructure (commuters? recreation? both?). Spatial data on bike routes and trails, if it exists, is rarely kept in a single central location and is often maintained by a number of different organizations, ranging from local park board websites to state natural resources offices. Collecting it and customizing it to your needs and the needs of the cycling community is not a simple task. Physical bicycle infrastructure can include grade-separated routes, off-street bike trails, on-street bike lanes, designating cycling streets, and bike boulevards. In addition to these features, the designer must be also be aware of features that may not be clearly distinguished in existing spatial dataset. Determination of other bicycle-centric features, such as service stops, bike shops, and parking locations, will require some subjective distilling of information from existing geographic data. To complicate things a bit more, many cities around the world are diligently investing in bike infrastructure and facilities are changing at a rapid pace. Ensure the map is easy to update, and note where new and future bike infrastructure exists or is under construction.

2. Redefine your visual hierarchy

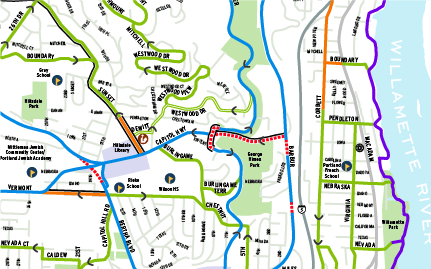
Portland, OR - Lesser important roads de-emphasized, but color scheme still unclear.

Portland, OR – Lesser important roads de-emphasized, but color scheme still unclear.

Bikes are not cars. A biker does not want to be riding down a major thoroughfare, nor does the rider want to be biking in areas with many natural, physical obstacles that may be irrelevant to those in a car. This requires reimagining your city and viewing it from the paradigm as if the major car-centric features are not there, or exist as notable landmarks and navigation points rather than a network of routes. Certain features that are important on a road map lose importance, for example, you cannot bike down an interstate. The interstate however will likely remain an important feature to include as it will give your readers context and a benchmark for navigation. Redefining the cartographic hierarchy will perhaps radically change the appearance of maps of the region, as different features than are normally called out are made to look more important, and defining features on other maps are given lesser emphasis. Krygier and Wood provide a well written summary of intellectual and visual hierarchy here.

3. Determine the map capabilities and means of distribution

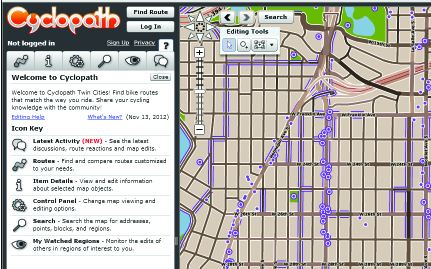
Cyclopath: OpenStreetMap for Biking

Cyclopath: OpenStreetMap for Biking

Also important is the means by which the user consumes the map, for example, a cyclist likely won’t use a map that only works effectively on his desktop computer at the office. This of course makes either mobile device based maps or paper maps the optimal means of conveyance. It must be considered that most bikes don’t have on-board navigation nor will they using their cell phones while they ride (I’ve tried, doesn’t work out well…), but many users will still have cell phones with them or have backpacks or pouches for clean, clear paper maps. The user won’t have constant access, but instead require sporadic access on demand. Turn by turn navigation is an interesting topic here, and some mapping giants have attempted this (see Google maps). They have had varying success, due to scarce standardized data and the lack of addressing a true means to reach the rider while he/she is biking. As mentioned above, making the map easy to make changes and update is important, as data changes rapidly as infrastructure grows and changes. One interesting attempt to address this, as well as collect an incredible amount of data, is community sourced biking mapping, a method used in projects like Cyclopath, which could be viewed as an OpenStreetMap exclusively for biking. Compare and contrast it to the Google bike maps.

There are a growing number of resources on bike maps out there, and most cities now maintain, or plan to maintain, bike maps for commuters and recreational riders. This post is the first of a short series on creating effective maps for bike transportation that will focus on design criteria and methods of a good bike map, survey, evaluate, and categorize a selection of bike maps, discussing what works and what doesn’t, and finally outline the creation of a new but perhaps familiar style of bike map from concept to completion.

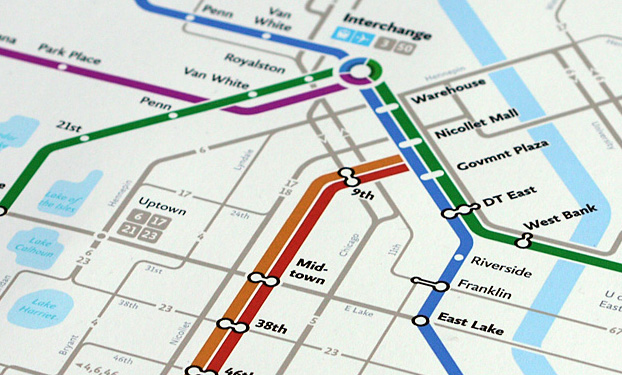
The Minneapolis Bike Freeway System - (c)2013 Graphicarto

A snapshot of The Minneapolis Bike Freeway System map – (c)2013 Graphicarto

Happy Mapping,

-Mike

Cognitive Cartography: Transit Map Style

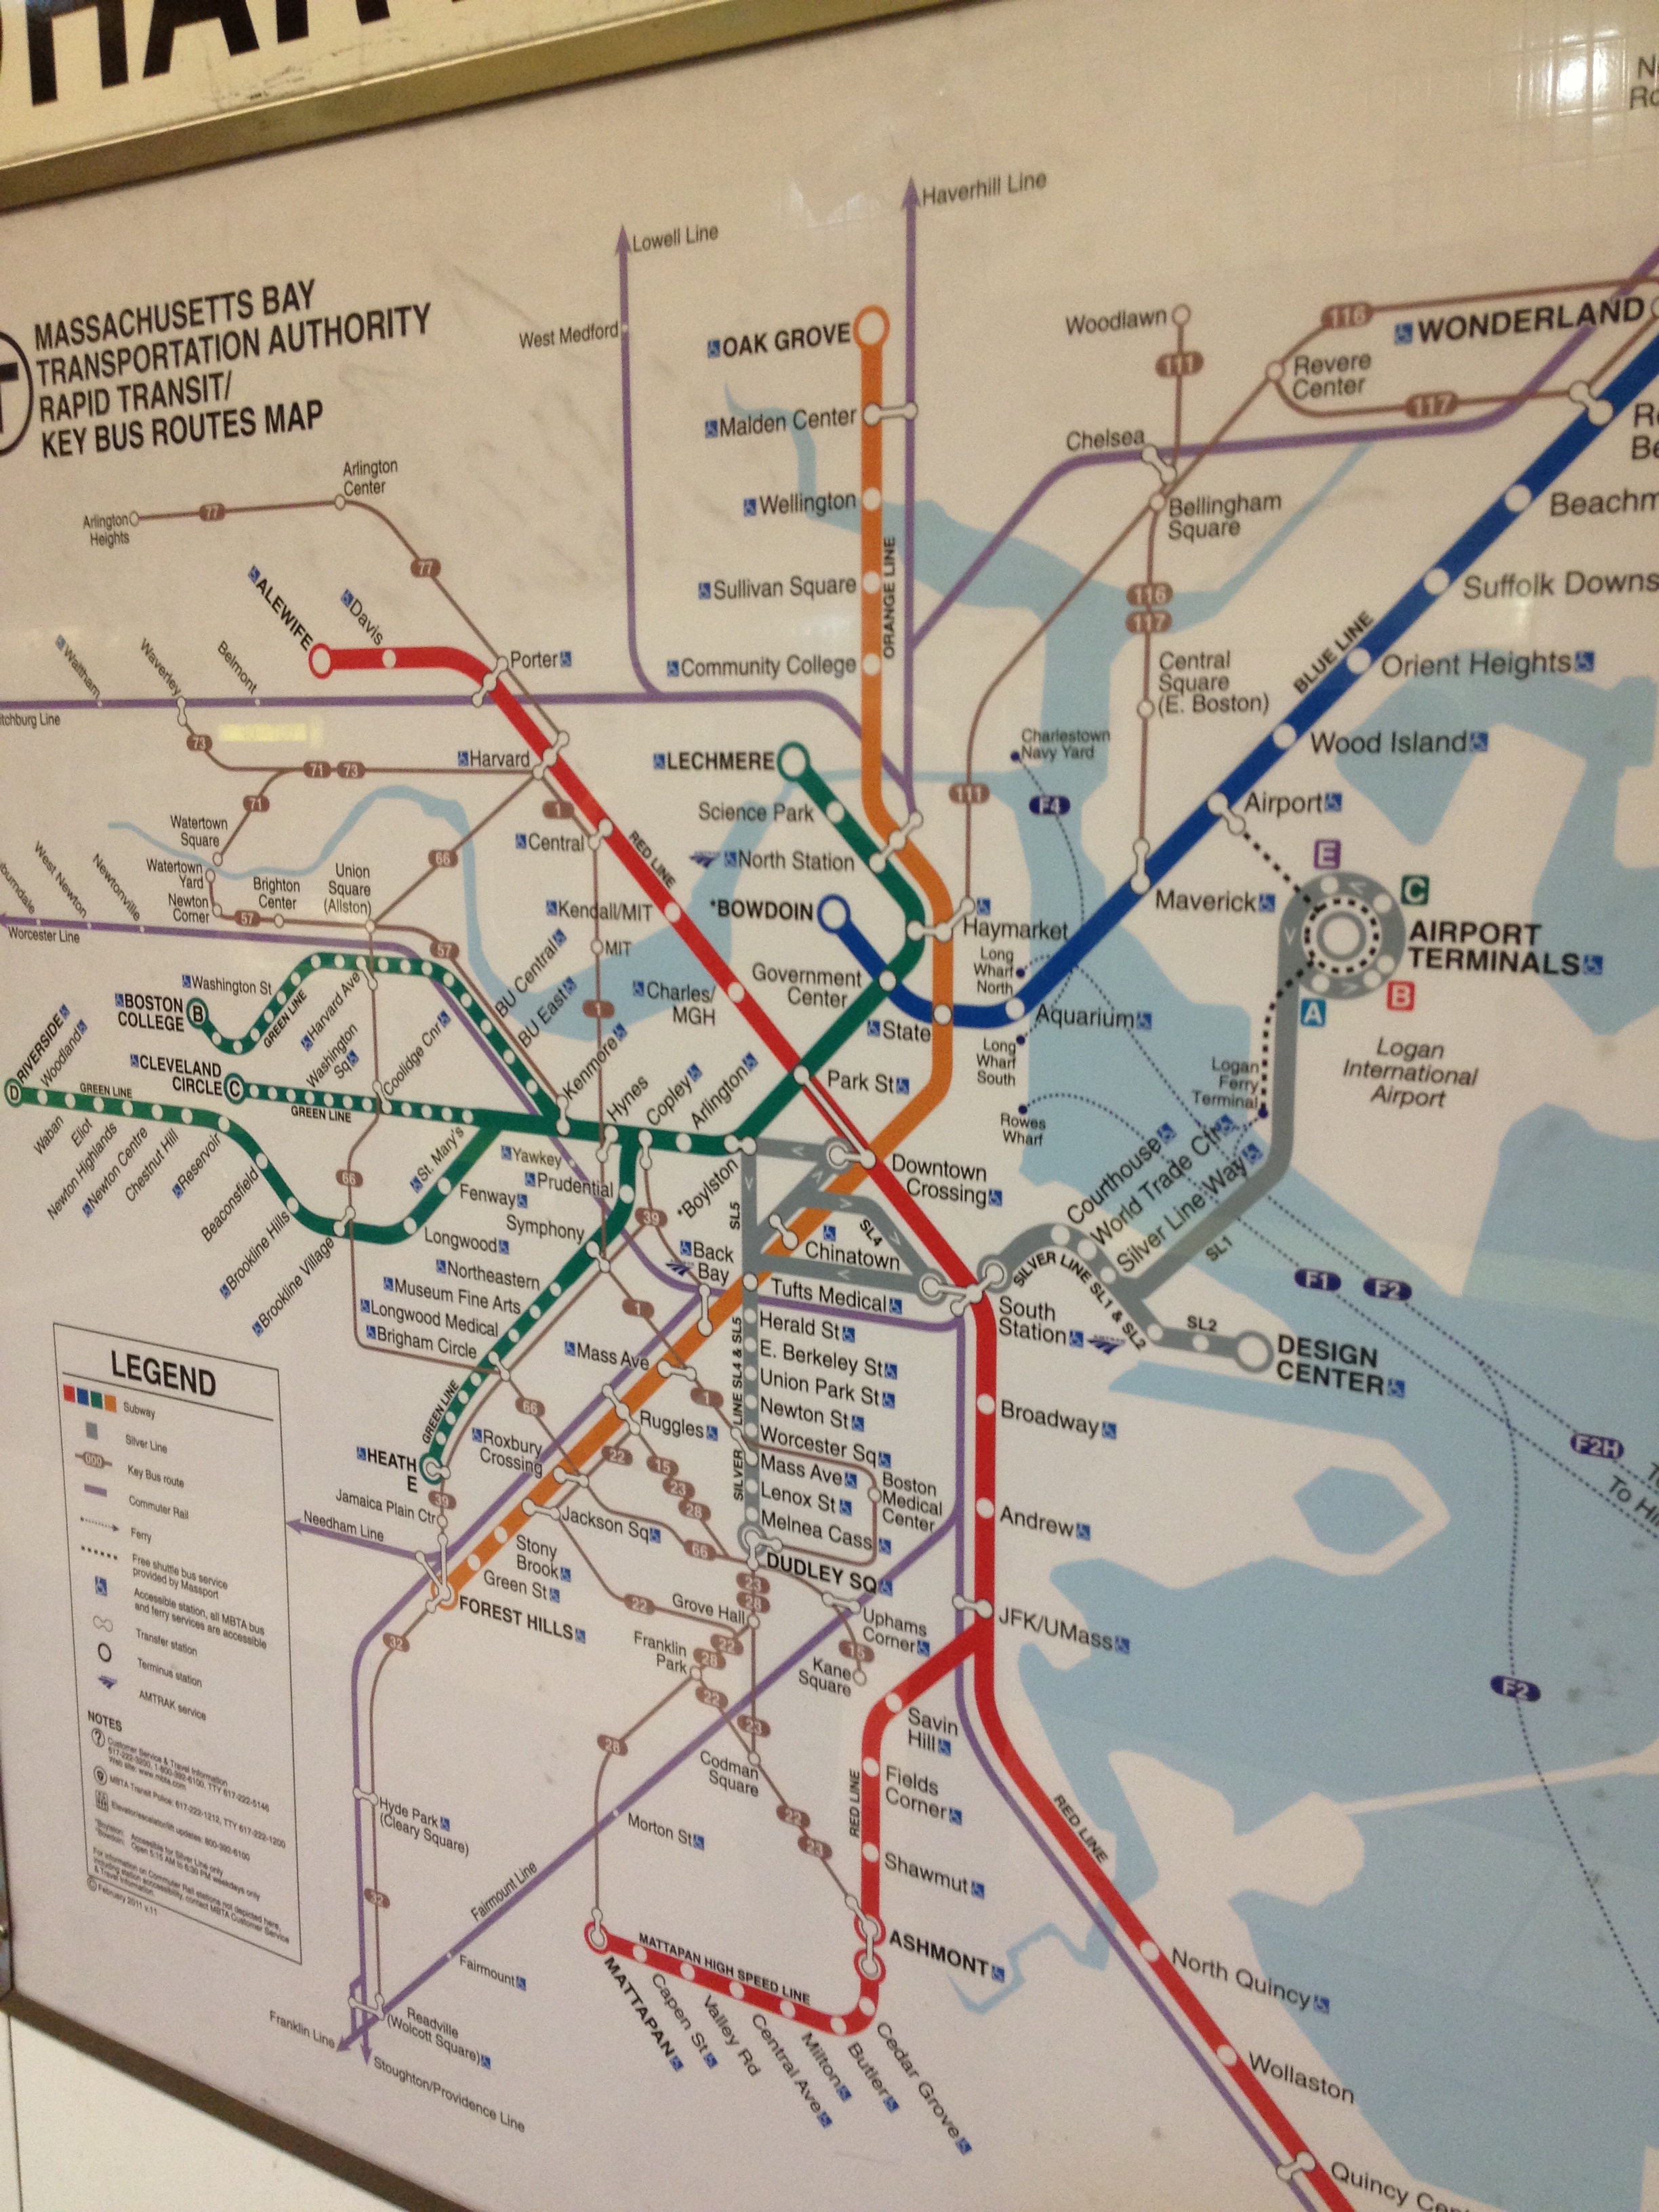
2013-01-21 10.29.16Cartographers have long had a quirky, and sometimes strange, fascination with transit maps. Since the days of Harry Beck and the first London Tube maps, an entire cartographic subculture has grown around them. No longer just limited to metropolitan transit systems, authors and map creators now use them to represent everything from river systems to rock ‘n roll.  Maps are, by definition, abstract visual representations and transit maps are no different. However, transit maps are especially notable. Very few visual graphics can communicate complex messages as quickly and efficiently, distill important features out out of an incredible amount of information with such ease, and seamlessly embed an illustrative sense of place and personality as a transit map. Perhaps most remarkable, and where in lies the fascination, is the abandonment of spatial relation and reliance almost solely on logical relation.
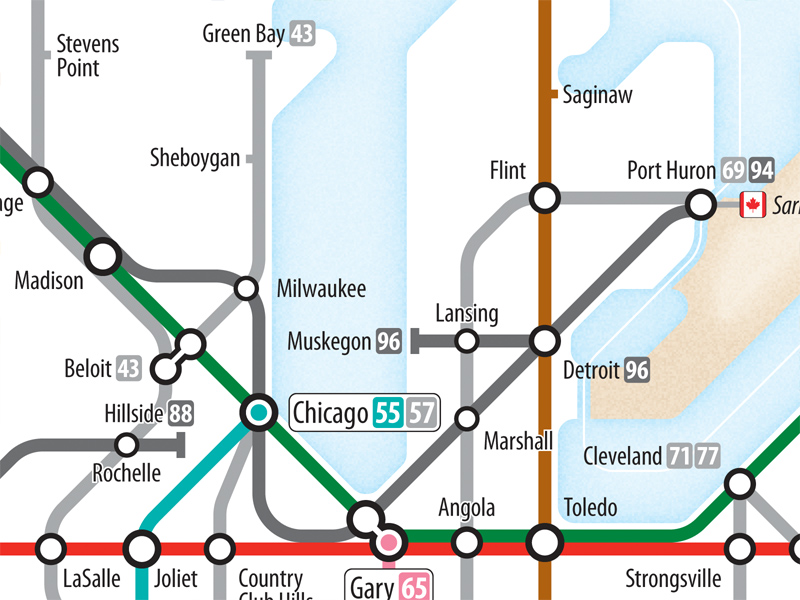
Transit maps are far from
what might publicly be considered a “normal” transportation map. Take the Interstate Tube Map by Cameron Booth for an example. When many think of maps, especially those used for transportation, there is an expected element of spatial accuracy, relation, and scale. One inch is equal to 100 miles… this town is directly south of this town… etc. These principles are bent, skewed, or even completely ignored in transit mapping. A transit map instead relies on points of interest and major landmarks to guide people in and around a community, and cartographers must not only have knowledge of the physical surroundings, but also intricate knowledge of their cultural subject matter.

People use these types of navigational techniques and use logical relation everyday in a process called cognitive cartography, or mental mapping. Mental maps are created in the mind of an individual and represent an individuals point-of-view perception of space within their own world. The most prominent Mental Map researcher was perhaps Kevin Lynch, an Urban Planning Professor at MIT, and the author of The Image of the City. Everyone creates Mental Maps, and they consist of the pictures in our head displaying landmarks used to navigate and way-find through everyday life. Mental maps are highly unique, but within a community there will be certain commonalities. Transit maps offer intrigue because in some ways they are the most mainstream and widely accepted example of mental mapping in the field. They expand beyond the individual, grabbing commonalities and features from many people, and can represent the collective “mental map” of a community.

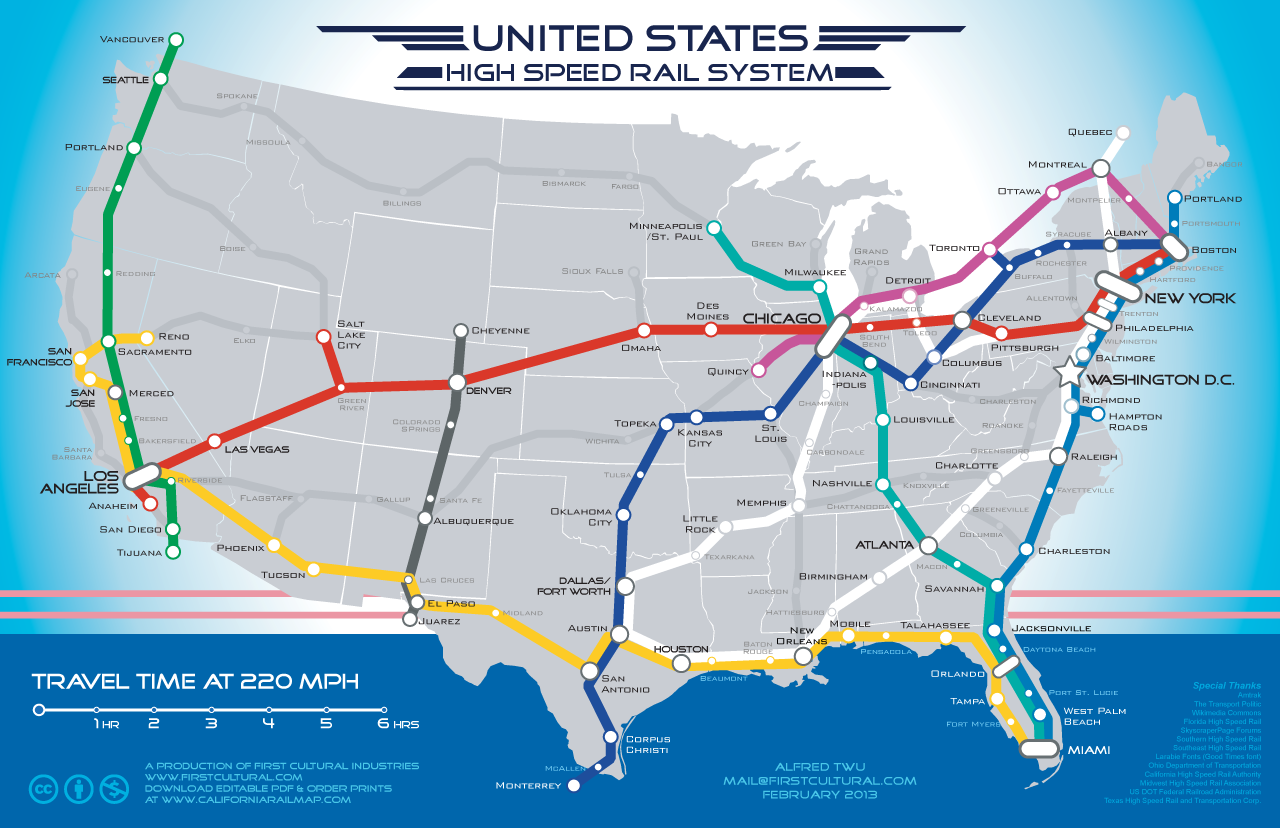
Transit maps can be utilitarian, but because of the extensive use of logical relation, they have an uncanny ability to show dreams and display fantasies with ease. Of course, all maps can do this, but transit maps have the ability to do so with the stroke of a few clean, primary-colored lines. Used correctly, transit maps can be highly effective tools to describe complex concepts in a simple manner, propose large projects, or further an agenda (see some maps made of a dream United States High Speed Rail System).

US-High-Speed-Rail-System-by-FirstCultural-2013-02-03

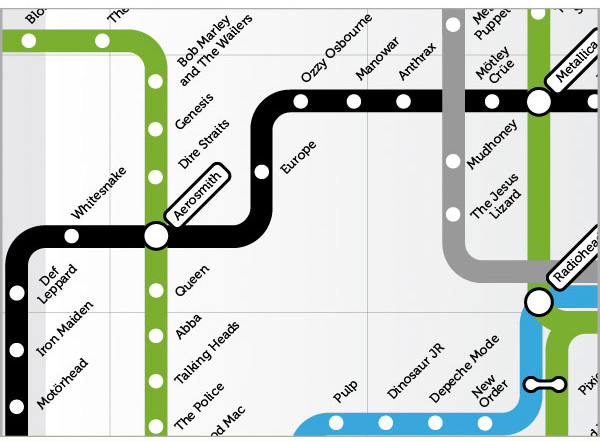
Essentially anything you can assemble into a system can be displayed in a transit map form, such as a collection of water drainage features and rivers, but you can also map the fantastic. Creative cartographers and adventurous authors have mapped everything from classic movies to internet trends to rock n roll.

AlbertoAntoniazzi_RockNRollMap_IMG2

Who knew you could listen to Aerosmith and take the Green Line to Bon Jovi?!  Happy Mapping.

-Mike


(A shoutout to the folks at Carticulate, you don’t even know the number of times I have pointed people to your color-coded skyway map.)

Why Apple Maps is a Good Thing (and you should use it)

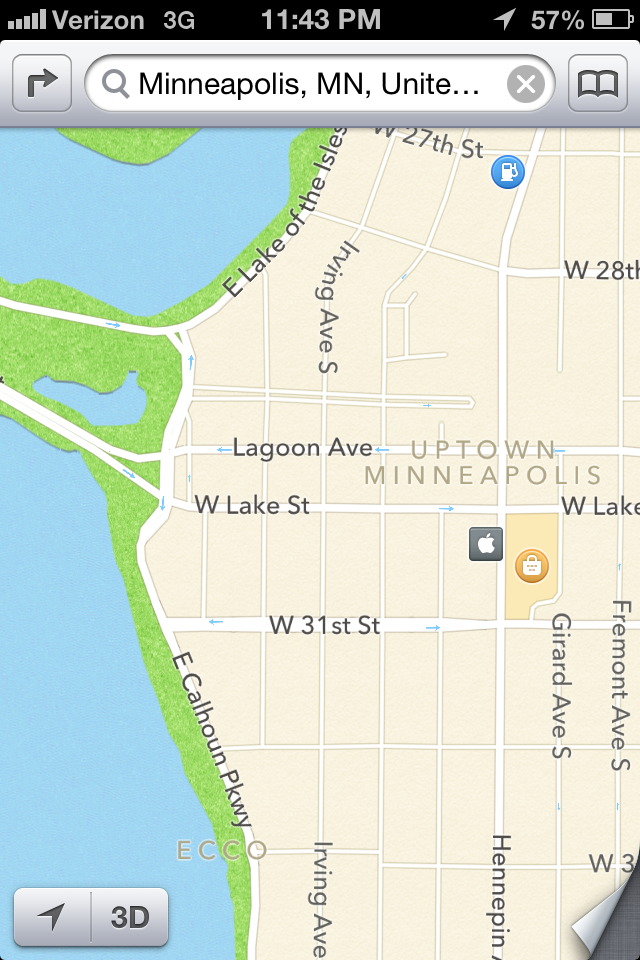
ScreenshotIn recent weeks, a lot has been said about Apple Inc.’s leap into the mapping world.  In an effort to free itself from a rocky reliance on a primary competitor, Apple decided to create its own mapping and navigation application.  Smart move, one might think, integrate a proprietary mapping application to complement its robust operating system, that would be great.  However, it didn’t work (… yet).  Negative reviews, generally citing a lack of substance and utility, have been scathing, and shockingly mainstream.  The underlying network and database have years of development and construction ahead of them.  Stadiums, theaters, and even entire islands, are out of location, or completely omitted.  Uncharacteristically, Apple publicly apologized, promoted use of other applications, and has even let go of designers and programmers. Kind of a mess, but this mess exposes a couple of important things, especially important to the mapping industry.  And with that, I am offering a rare positive review of Apple Maps, from a different perspective.

Four Reasons Apple Maps is Good:

1. Our societal dependence on maps is exposed.

The release of the application, followed by the magnitude of outcry, exposes our societal reliance on mapping applications in 2012.  Consumers have become so used to mapping applications (Google, Mapquest, Bing, etc.) giving them directions and information with extremely high accuracy that when this capability is reduced, it becomes stunningly disabling to complete some of the most simple things we take for granted.  A mapping application can’t find me a freeway exit with a McDonalds?   The bar I’m going to for Happy Hour is a block away in the wrong place?  These are things we take for granted in 2012, and expect perfection from it.  This is remarkable in itself, and when Apple Maps couldn’t do this the outcry was stunning.

2. Competition is introduced into an important modern day amenity.

Apple entering the mapping world brings another huge player into the mapping game.  This only stands to benefit the public in the long term, as I foresee and “arms war” of sorts taking place between Google and Apple.  Another player in the game, especially the size of Apple, will force Google, Bing, and others to not fall into complacency, and continue ambitious goals aiming to catalog and map the entire globe.  Expect to see mapping applications to improve at even more rapid rate, with increased real time data, improved navigation networks, and better landmarks and points of interest.

3. The difficulty of creating, maintaining, and keeping a good geographic dataset is displayed.

Geographic datasets are dynamic and huge, yet remain one of the more understated achievements of modern society.  Mapping and maintaining data on roads, businesses, public spaces, hospitals, etc. is an extreme challenge to even the most robust organizations and individuals.  In many circumstances, the second a geographic data point is collected, it is already out of date.  People move across the globe all the time, new businesses open and close, buses come and go, rivers meander and flow, and wetlands and forests grow and shrink along with the development around them.  Building a comprehensive “map” of everything on Earth is an impossible task, yet many people demand it, not knowing the effort required to provide such services.

4. Even with the best design, you need good data.

I admit, I like the design of Apple Maps.  (see Bing… and you’ll agree)  The 3D buildings are great, the navigation application looks very slick, and maps themselves look sharp.  However, the good design is quickly lost when you can’t find your way to the nearest bar for a drink, or stadium for a game.  Good design is paramount, it brings people in and turns eyes, but you have to keep the map relevant once the admiration of all eye candy fades.  An equilibrium between flash and substance must be achieved, or in the end all you have is a nice piece of art to hang on a wall.

All this considered, Apple screwed up and frustrated a lot of people, but everything might be a blessing in disguise.  The emergence of another force in the mapping field will only benefit all of us in the end.  Keep using Apple Maps, force them to get better, and in effect force the whole field to improve.

Welcome to Graphicarto!

Derived from the melding and mixing of graphics, art, and cartography, welcome to graphicarto!  This is a blog that aims to discuss all the current events, cutting edge trends, and new technologies in the world of graphic design and cartography, not just from the perspective of a practicing modern day cartographer and GIS professional that uses the stuff to pay his bills, but also from a truly passionate angle and as a way to share some of the fun work I do.

Sure, like most blogs, it’ll probably be just a bunch of mental spewing, but hopefully reading will occasionally expose an insight, or at least spark a couple creative responses.  Enjoy!

-Mike